2-D Rectangles-in-Circles Packing and Stock Cutting
Discrete Optimization - Benchmark Problems - Packing - Stock Cutting
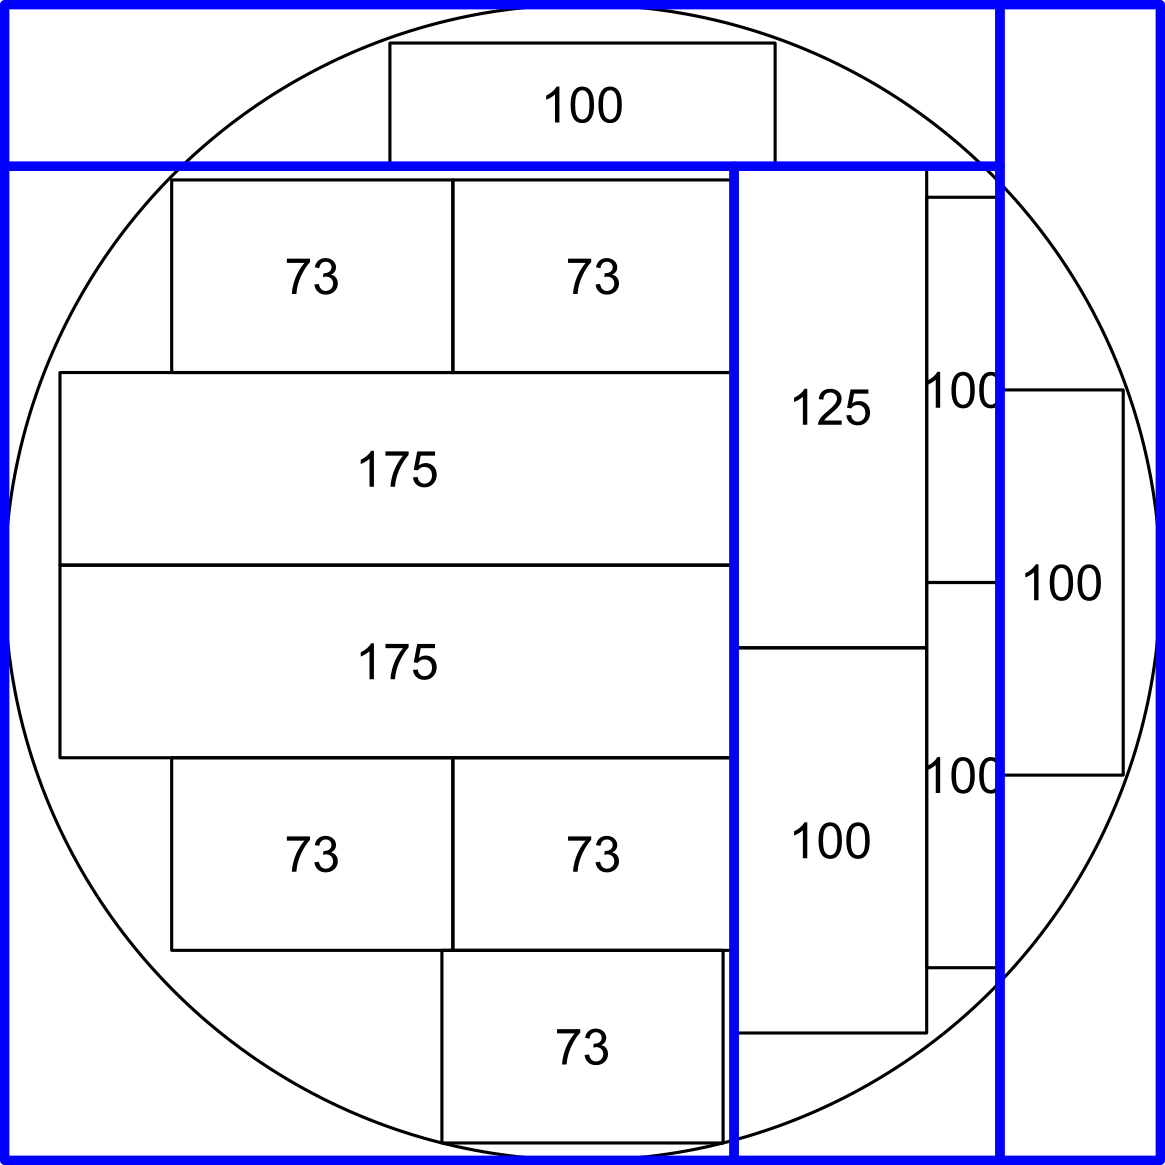
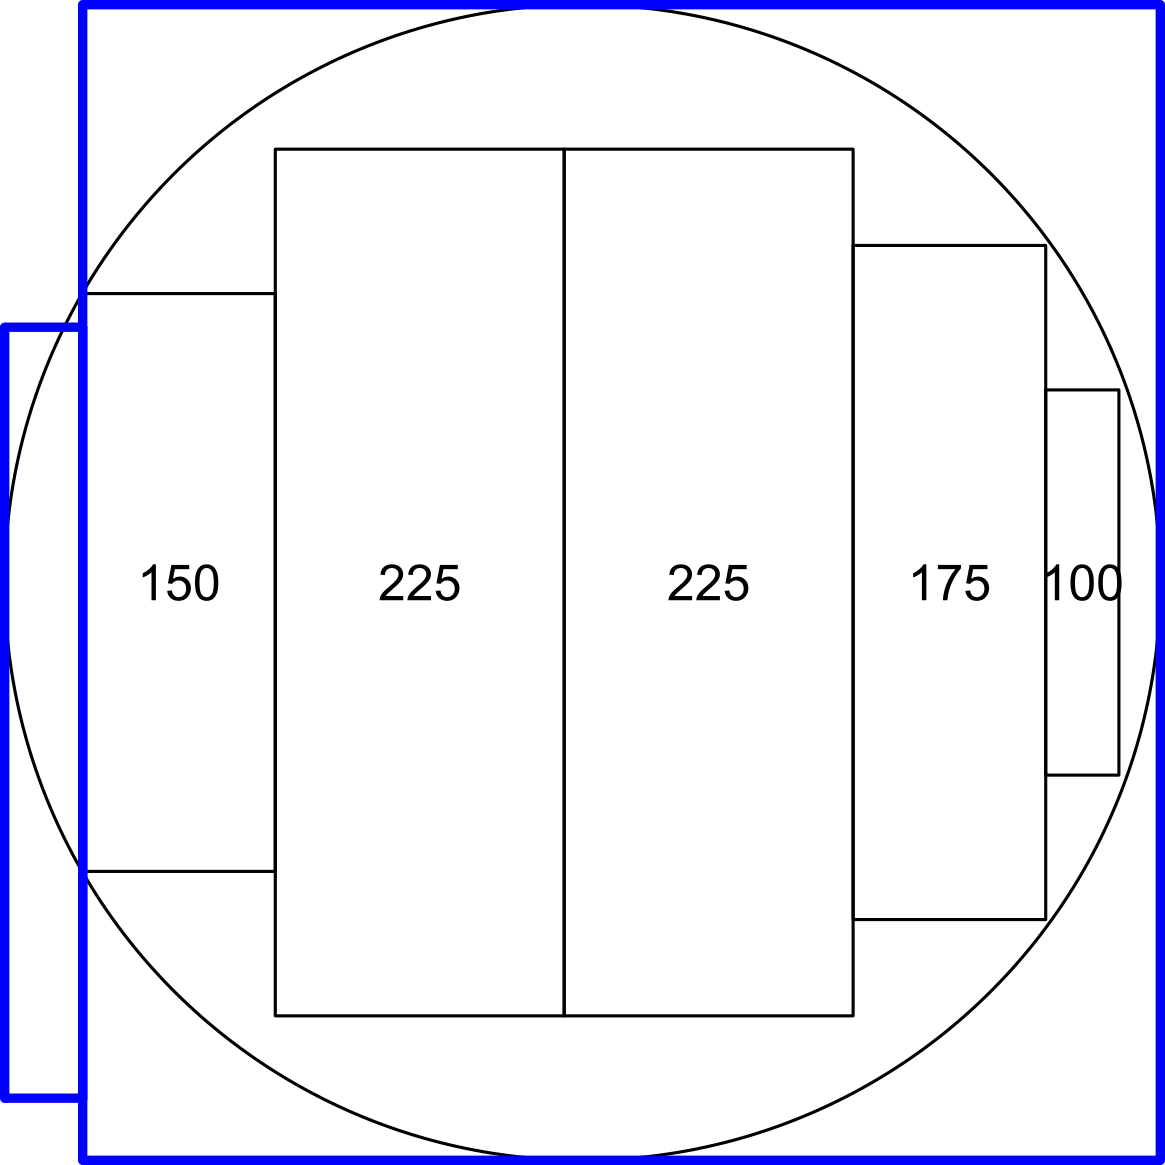
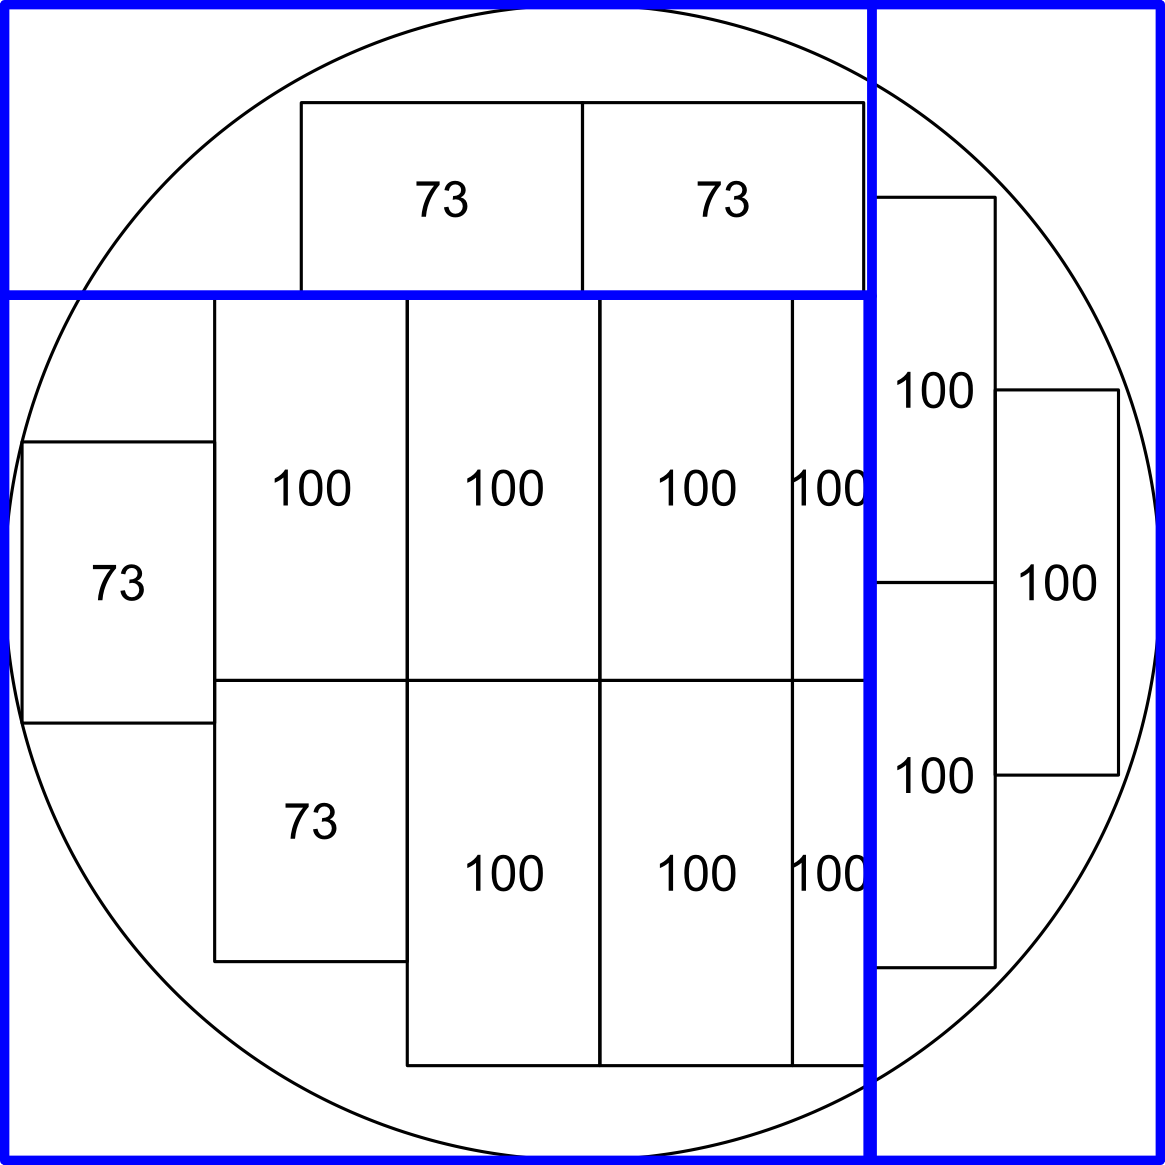
Benchmark files are given in a JSON format. Each file describes a set of input cylindrical shapes (tree logs) of a given length, diameter and count and a set of rectangular cuboids output product types (sawn timber) of a given thickness, width and length. As the benchmark is currently intended for 2-Dimensional cross-section optimization the lengths of all objects are set to 2 meters and intended to be used only for computing the cubic meter value.
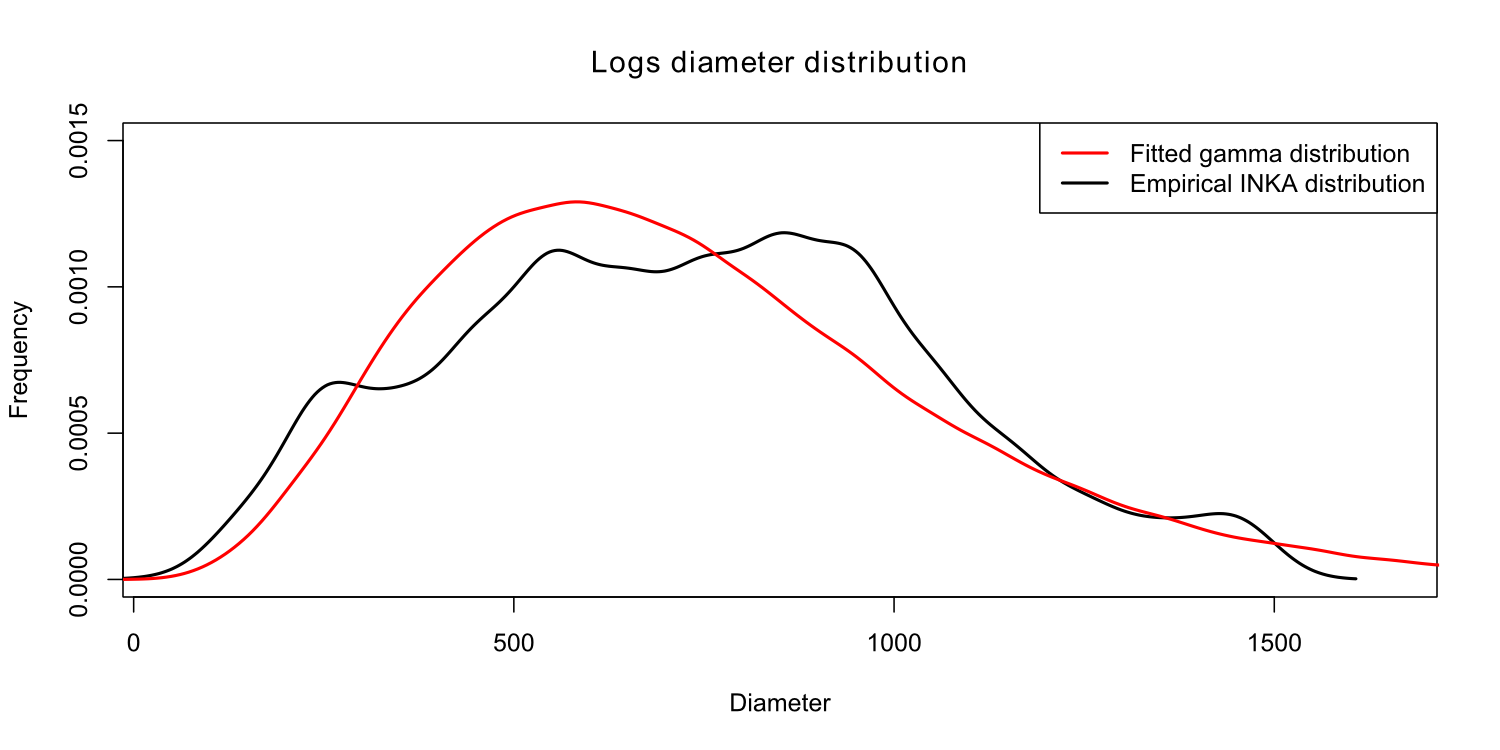
In order to create an artificial, but still real-world based, benchmark set for 2-D this particular packing and stock cutting problems two sources coming from Finnish timber industry have been selected. The first source is the list of thickness and width dimensions of the typically produced pine sawn-timber products. The second source is the list of height and diameter of trees harvested during a study of industrial pine forests. Using the harvested trees statistics a set of 2 meter logs has been generated, with their diameters and count following an empirical gamma distribution fitted to those statistics.
| Thickness | Width | Length | Value m3 | |
|---|---|---|---|---|
| 1 | 19 | 100 | 2000 | 1.00 |
| 2 | 25 | 100 | 2000 | 1.15 |
| 3 | 32 | 100 | 2000 | 1.30 |
| 4 | 38 | 100 | 2000 | 1.41 |
| 5 | 38 | 125 | 2000 | 1.58 |
| 6 | 50 | 73 | 2000 | 1.39 |
| 7 | 50 | 100 | 2000 | 1.62 |
| 8 | 50 | 125 | 2000 | 1.81 |
| 9 | 50 | 150 | 2000 | 1.99 |
| 10 | 50 | 175 | 2000 | 2.15 |
| 11 | 50 | 200 | 2000 | 2.29 |
| 12 | 75 | 200 | 2000 | 2.81 |
| 13 | 75 | 225 | 2000 | 2.98 |
| Diameter | Length | Count | |
|---|---|---|---|
| 1 | (100,300] | 2000 | 6610 |
| 2 | (300,500] | 2000 | 20702 |
| 3 | (500,700] | 2000 | 25313 |
| 4 | (700,900] | 2000 | 20668 |
| 5 | (900,1100] | 2000 | 13023 |
| 6 | (1100,1300] | 2000 | 7191 |
| 7 | (1300,1500] | 2000 | 3510 |
| 8 | (1500,1700] | 2000 | 555 |